Why Financial Wellness Starts with Account Aggregation
May 20, 2026 | 3 min read
Account aggregation leads to better financial wellness and MX platform users have a clearer picture than the average consumer.

Copied
April 11, 2018|0 min read
James Dotter, CFO at MX, recently presented a webinar as part of the MX Data Webinar series. You can see the recording, download the deck, and read a transcript below. Above all, this webinar will show you how to get started with big data.
Note that this transcript has been edited for length.
In speaking to financial institutions, I commonly hear people say, 'I understand the value of data, but where do I start?' I want to focus in on that question today.
First off, we're facing something of a paradox about data today. I recently read a study from PwC that put a dollar tag on financial transaction data of $300 billion annually. But I also read a report from Gartner that estimated that 60% of all big data projects will fail. And after the report was published, I've seen a number of analysts at Gartner update the estimate to 85%. In short, we face this paradox in financial services that although there's this goldmine of data there's also possible failure.
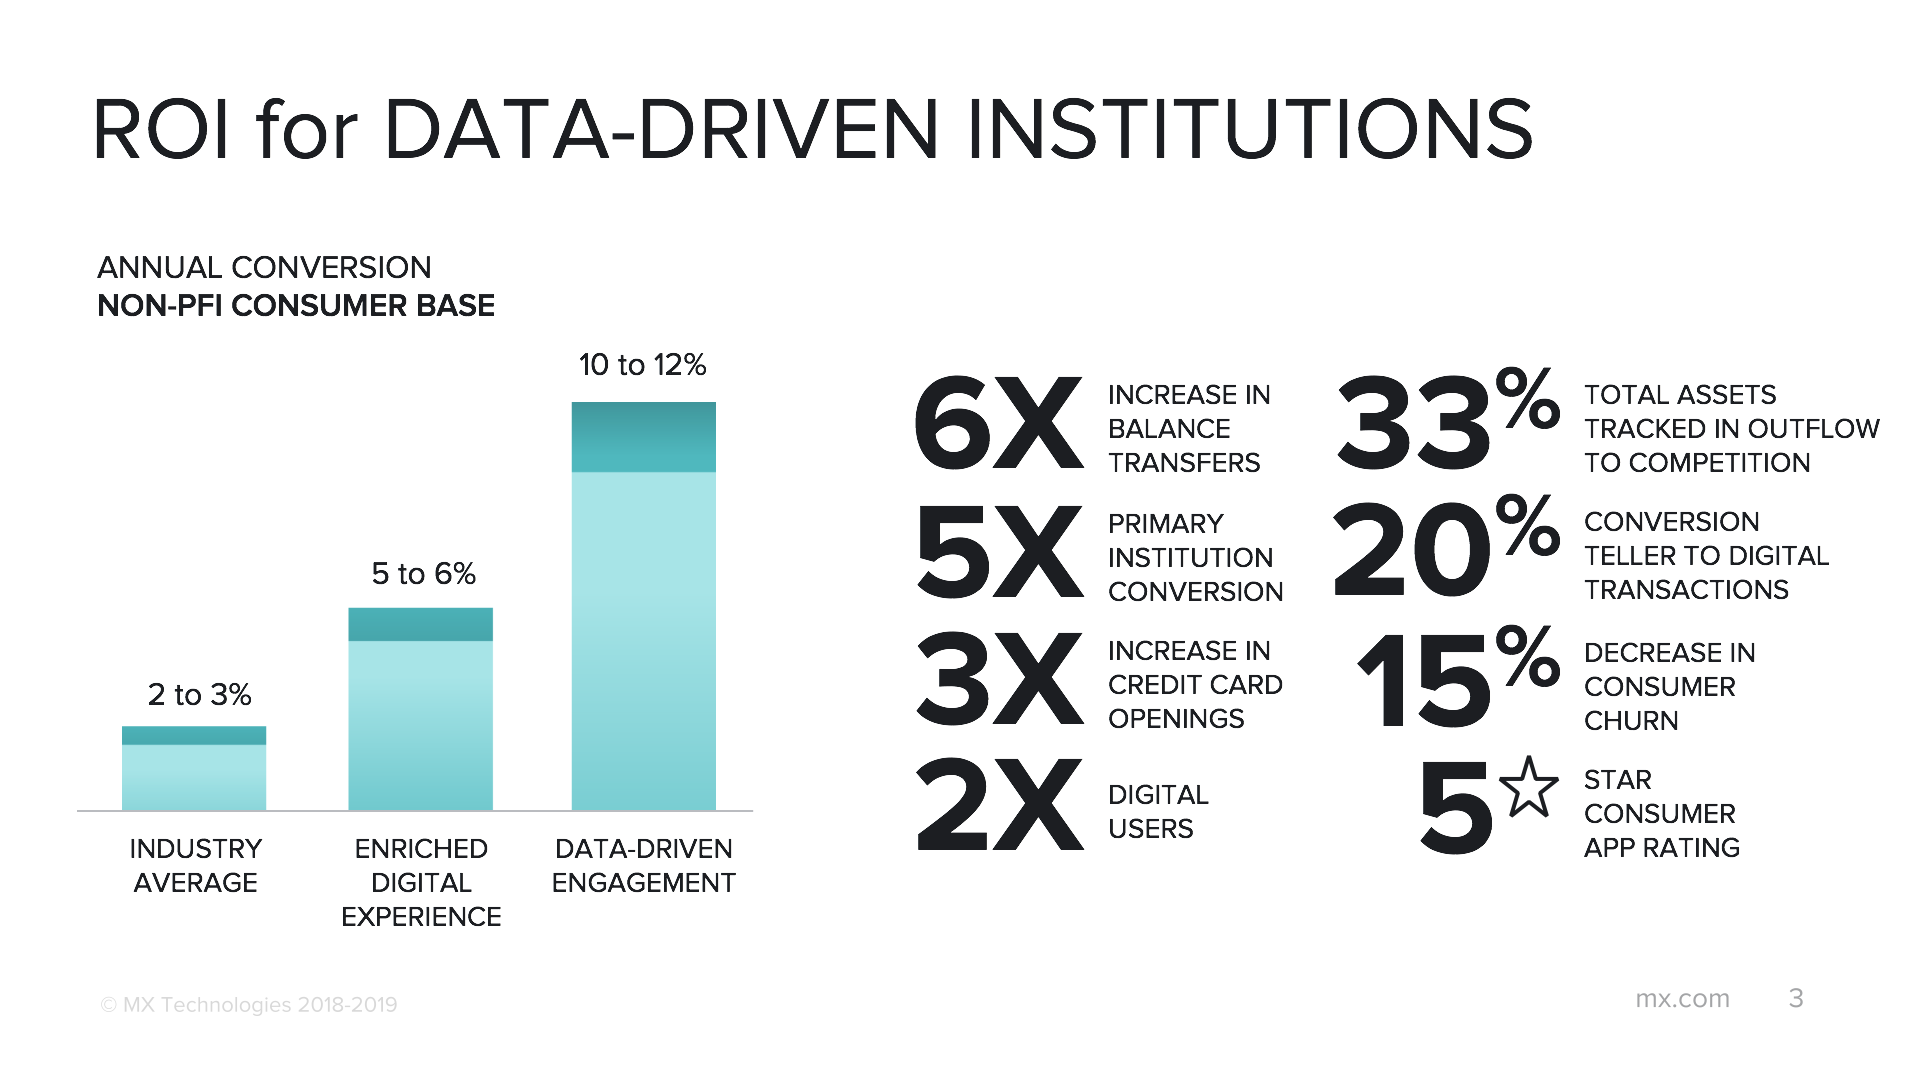
Fortunately, we're currently seeing a number of financial institutions see success with the data and begin to realize ROI around it. In fact, we see institutions using the data to increase conversion ratios. The average is seeing uplift of 2-3% while those who offer an enriched digital experience are seeing 5-6% and those who are using data-driven management are seeing uplift of 10-12%.
We're also seeing massive increases in other metrics. For example, 6x increase in balance transfers, 5x increase in primary institution conversion, 3x increase in credit card openings, and 2x the number of digital users. These institutions are also able to track 33% of total assets flowing out to their competitive organizations. They've been able to convert 20% of their teller-based transactions to digital transactions, saving a significant amount of money. We've seen a 15% decrease in churn and an improvement in user ratings.
To do this requires helping institutions to collect and enhance, present and analyze, and act and iterate on data. It starts with structuring a data strategy around these three concepts and then mapping that onto operational and financial impact for the institution. For example, we've seen that institutions that take a data-driven approach to product design see an increase in banking product adoption rates, which ultimately results in more profitable products for the institution.
So if that's what we're driving towards, it brings a question to mind about whether we're seeking artificial intelligence or intelligent automation, meaning leveraging data in the day-to-day processes in which we're engaged.
It all starts with data, which is leveraged for reporting, progressing to analysis, and then prediction. There are also activities, which become procedures, expanded into workflows, and ultimately systematized. And where data and activity converge, that's where we see intelligent automation happening.
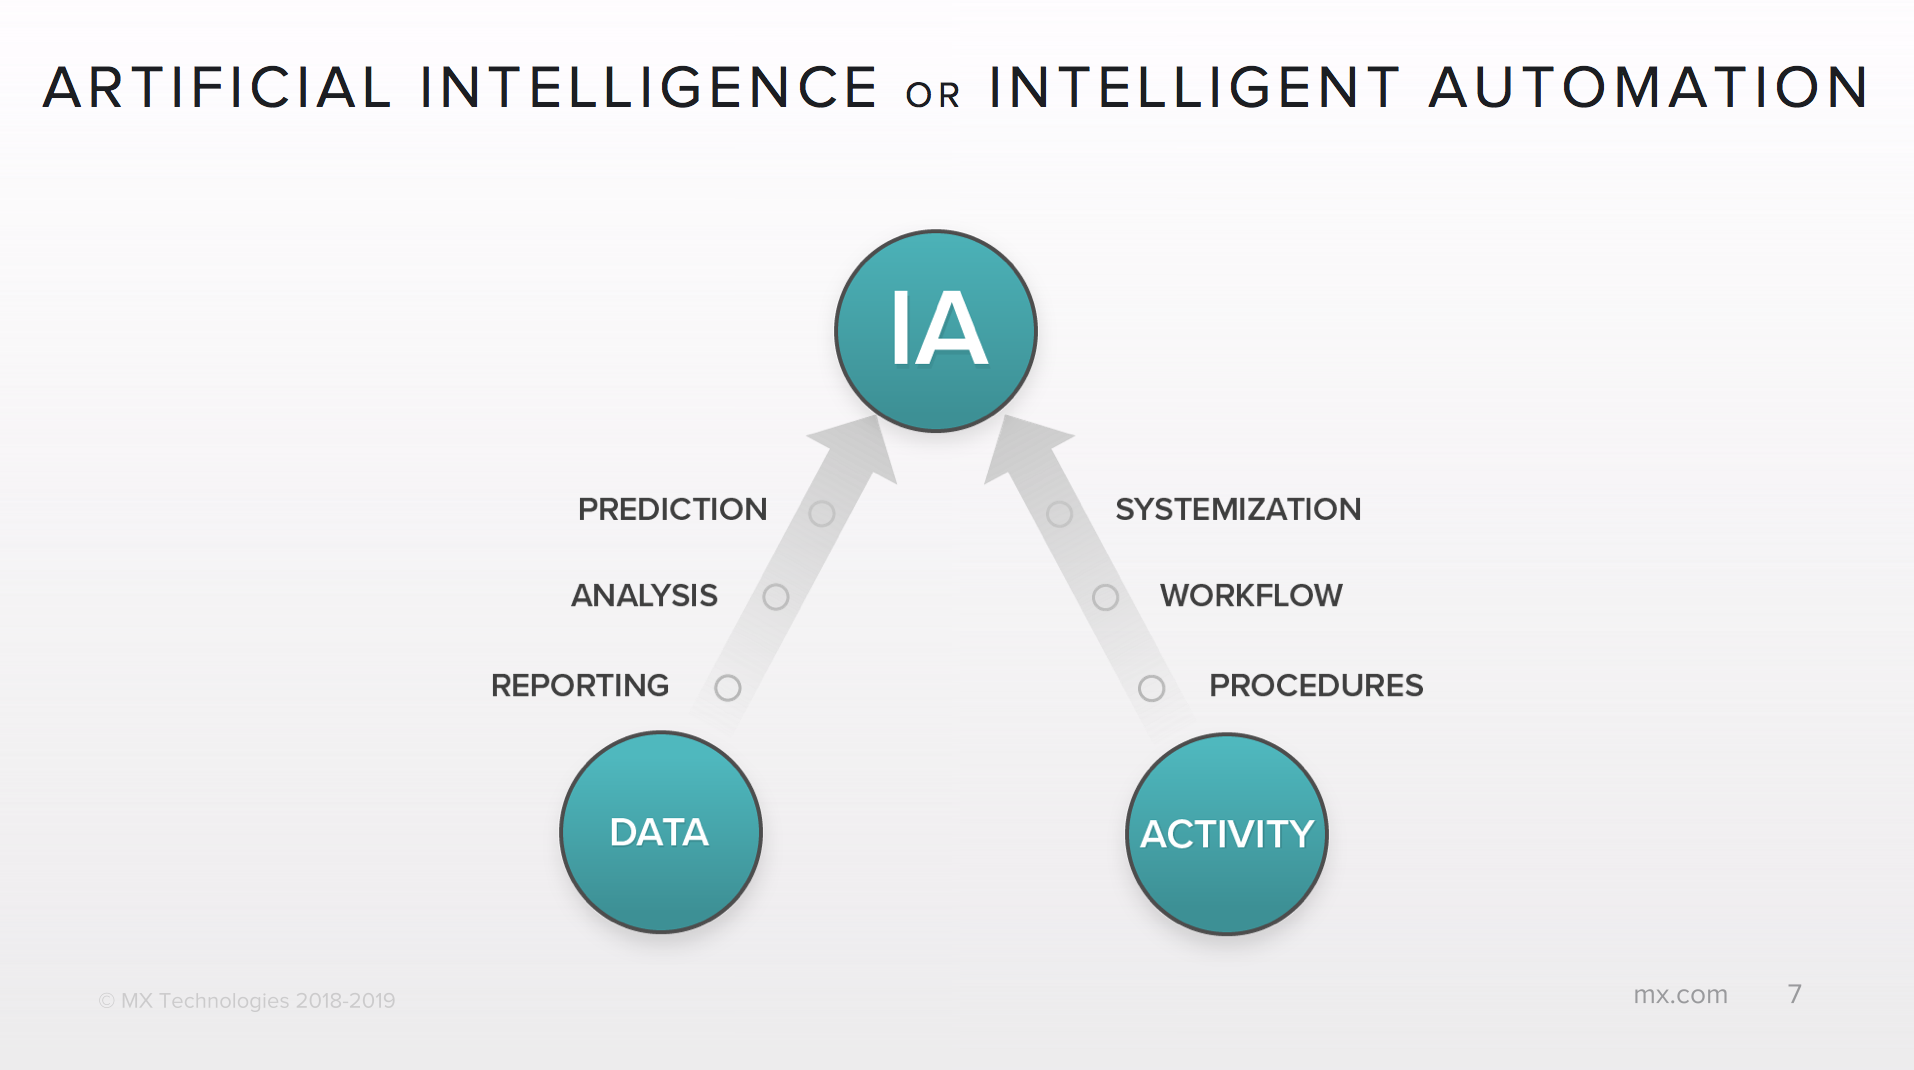
And in my conversations with financial institutions, I've seen that this has always been the crux of what everyone is looking for when they discuss artificial intelligence.
So that's great, but there's still the question of how to get started. Regardless of your destination, your foundation will determine your success.
This foundation starts with four steps:
Let's look at each point in detail.
Your culture will determine how successful you are when it comes to data. If your team members don't believe in the power of data, you're going to struggle to be data literate. So start with your head of HR to screen future employees for data competency. Send current employees to trainings on how to successfully implement data across your organization.
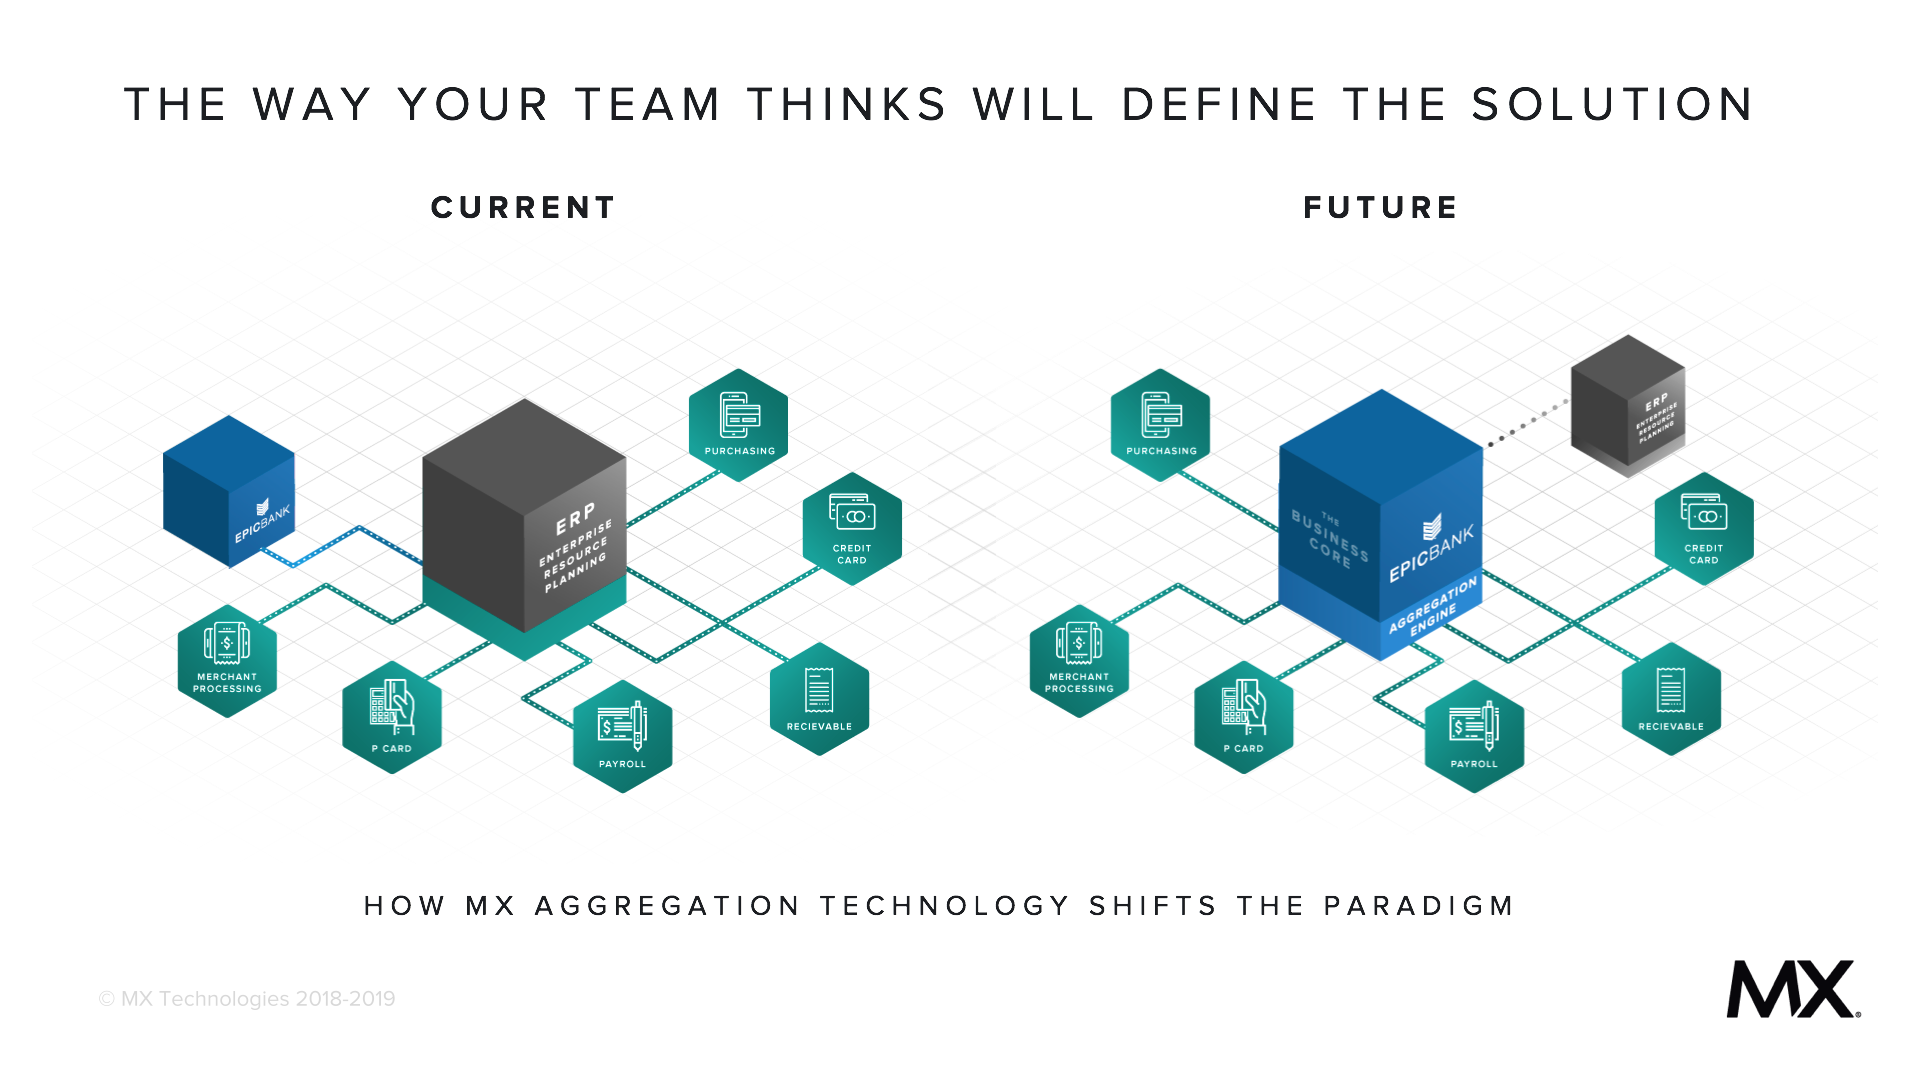
The way your team thinks will define the solution. For instance, many institutions think of the ERP or accounting system of a customer business as the center of that universe, or the source of truth. But those institutions ultimately should have been and still can be the center of the financial universe for the customer business. This is the future of financial services — a future that occurs when the culture is aligned with data.
Knowing your desired business outcomes requires you to begin with the end in mind — to know the metrics you'll measure and how far you want to measure those metrics.
Everything hinges on getting the right metric framework, which includes asking what metrics are most relevant and what metrics are most acceptable.
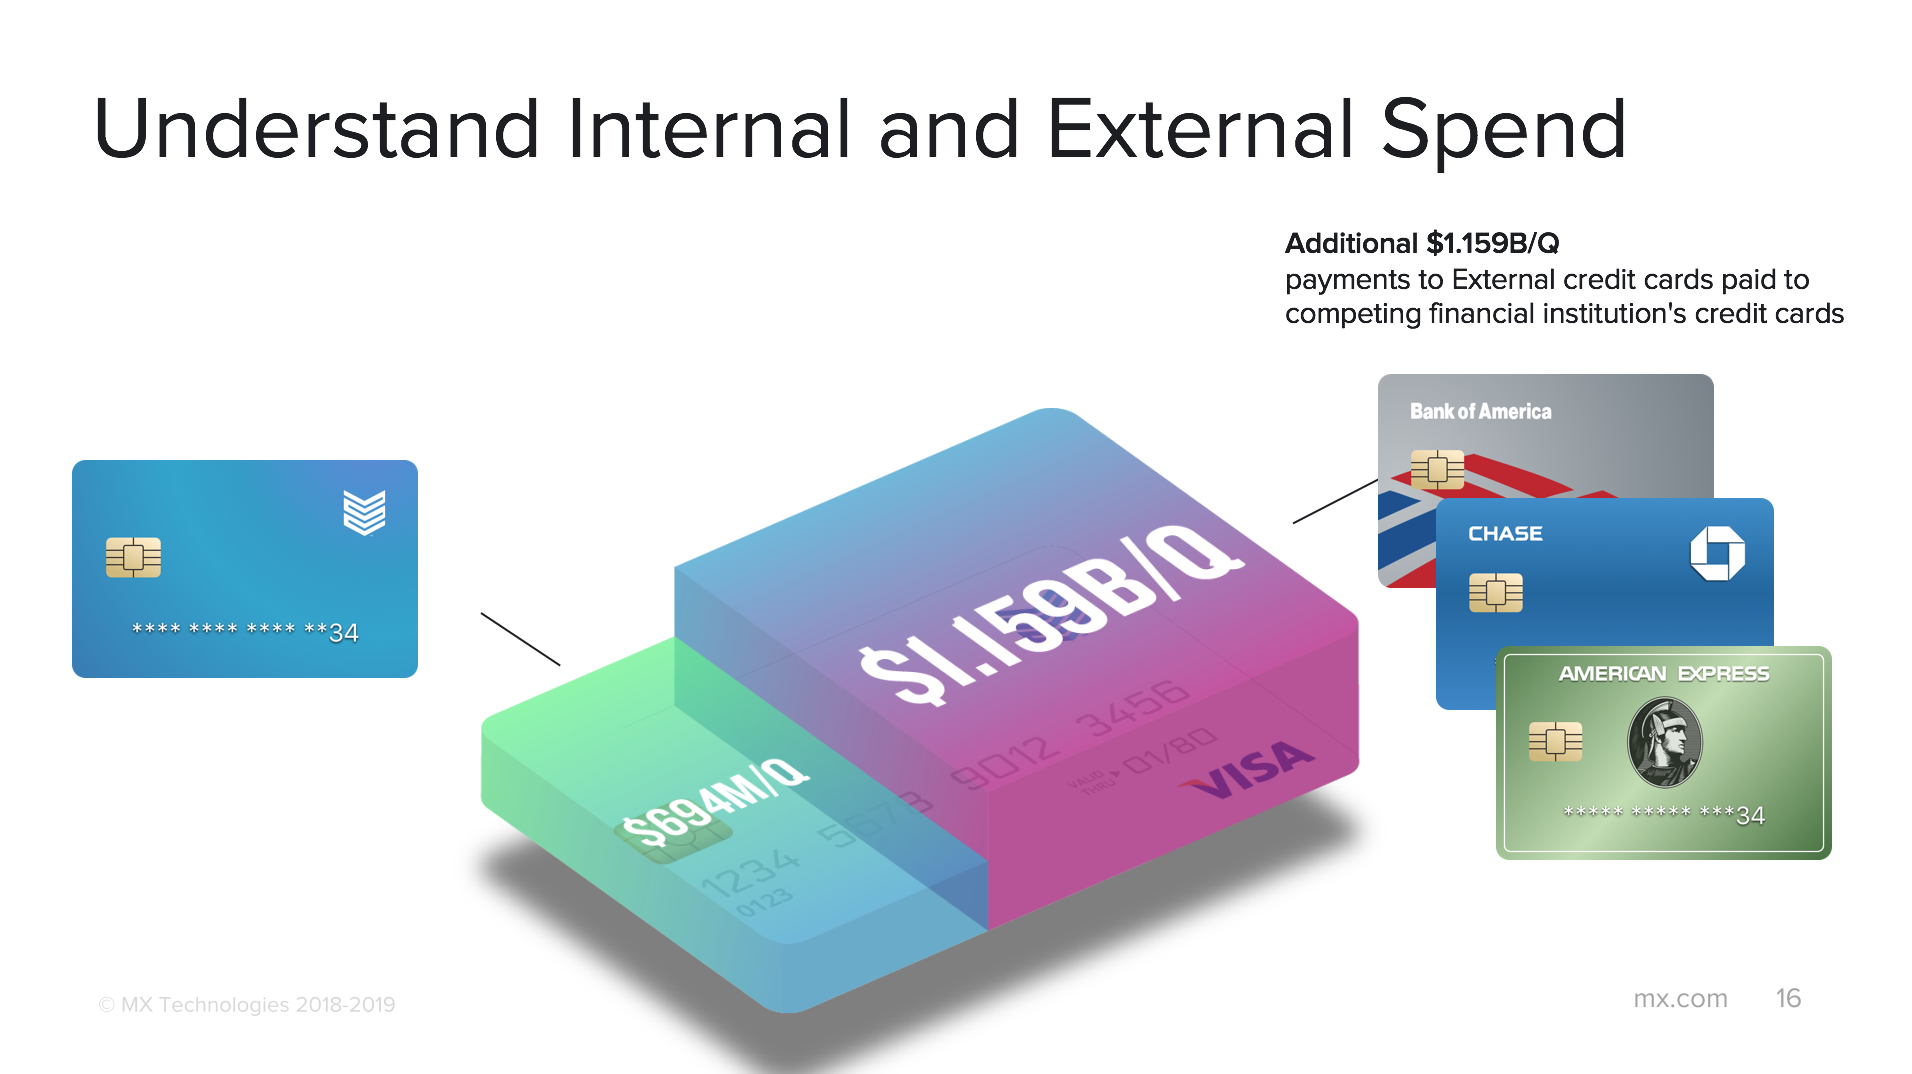
In this vein, we've helped our partners understand their internal and external data so they can see how much money from their account holders is leaving to other institutions. For example, one client found that $1.159 billion was flowing out of their institution to their competitors each quarter in the form of credit card payments.
Operational excellence requires four steps. First, it starts with areas of ownership — deciding who owns the process. It can't be multiple people. It must be one person, and they must be accountable. Second, it requires a clear process. Third, it requires an understanding of data and systems. Fourth, you must decide the metrics you want to measure.
Once these steps are in place, you will be able to fuel automation for your organization. This will in turn enable you to be forward thinking.
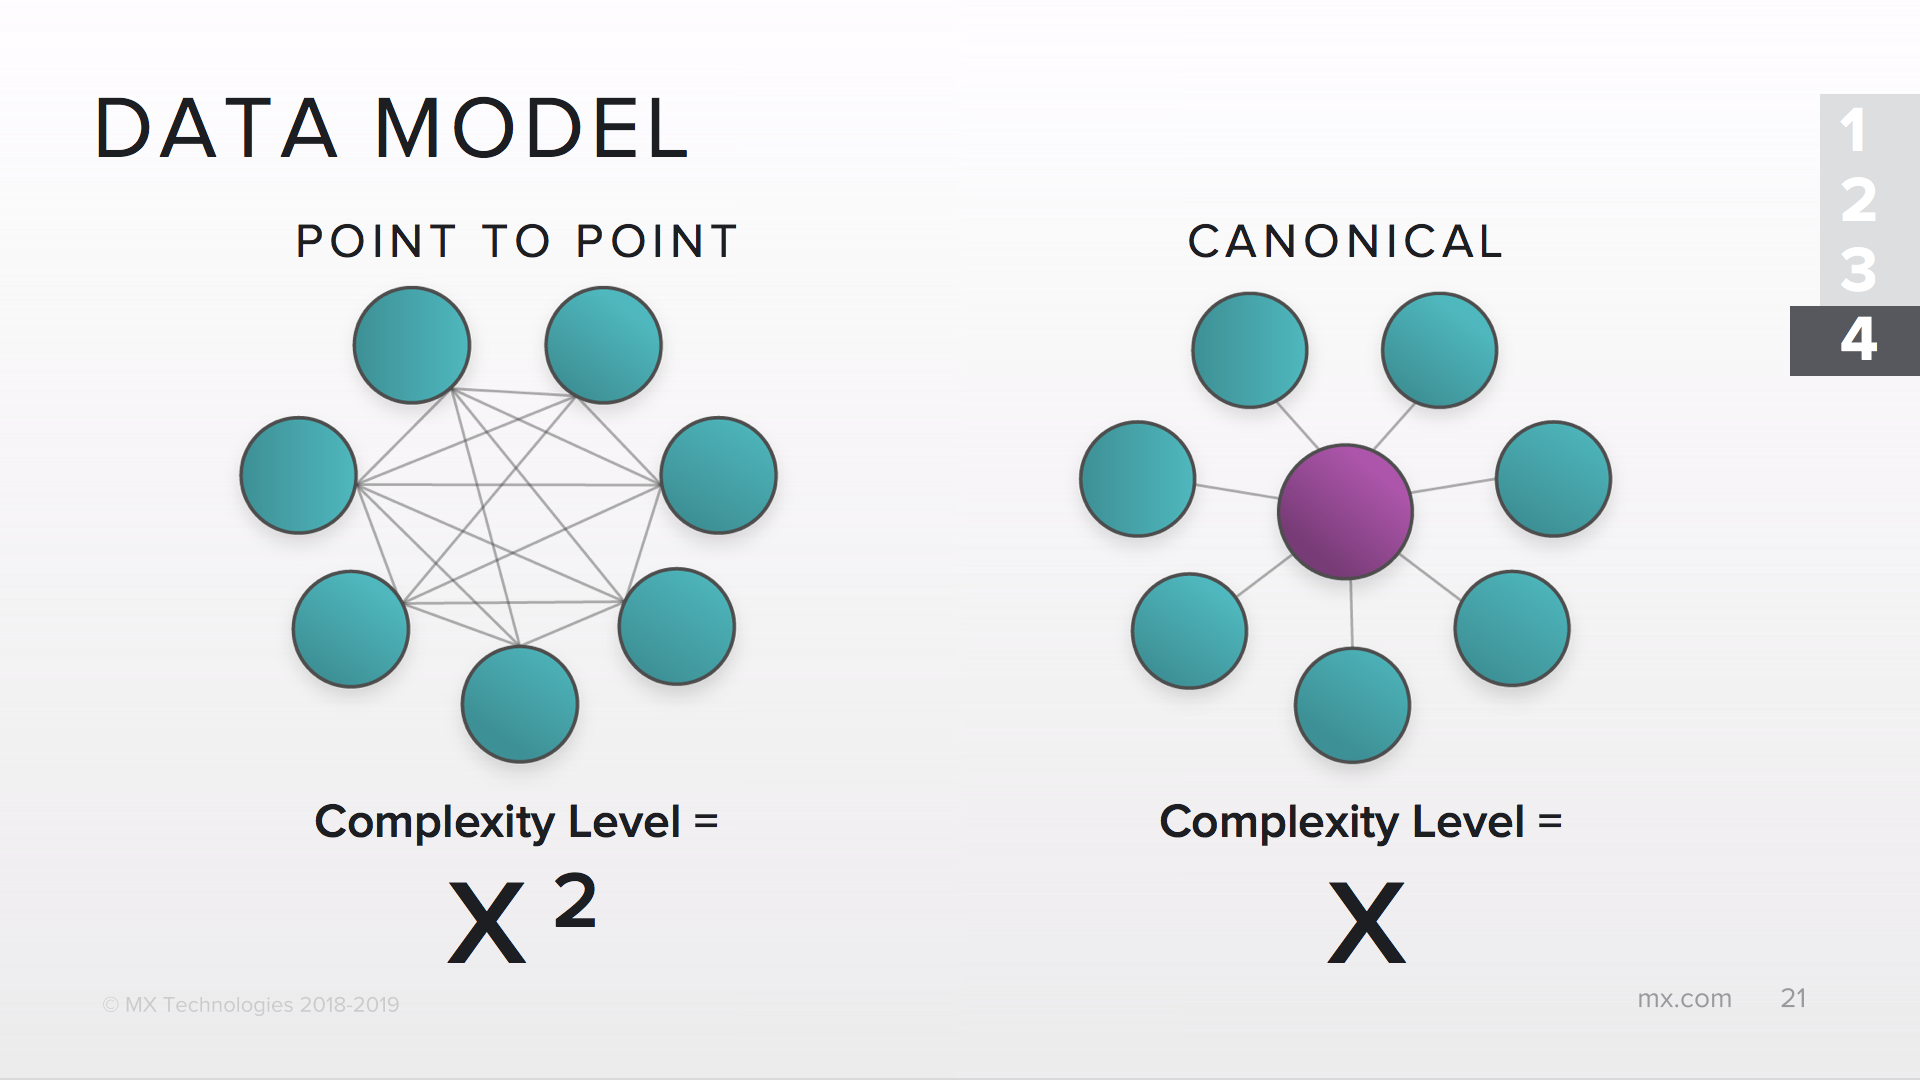
This may require a conversation with your IT team, but the main point here is that it's essential to simplify your data model. We see financial institutions of all sizes struggling with this problem, and while it's okay to have disparate systems, the question is whether you have a canonical model that allows you to understand your data from a centralize point across all of your systems.
You might use a point-to-point model, which is complicated. You might hear IT teams wrestle with the spaghetti bowl of data they're working with, and if so they're likely working on a point-to-point model. By contrast, a canonical model simplifies things and helps unify the perspective for your team.
In the end, these four steps will pave the way for you to get started with data and thrive in the industry going forward.

May 20, 2026 | 3 min read
March 18, 2026 | 3 min read
Dec 10, 2025 | 3 min read
